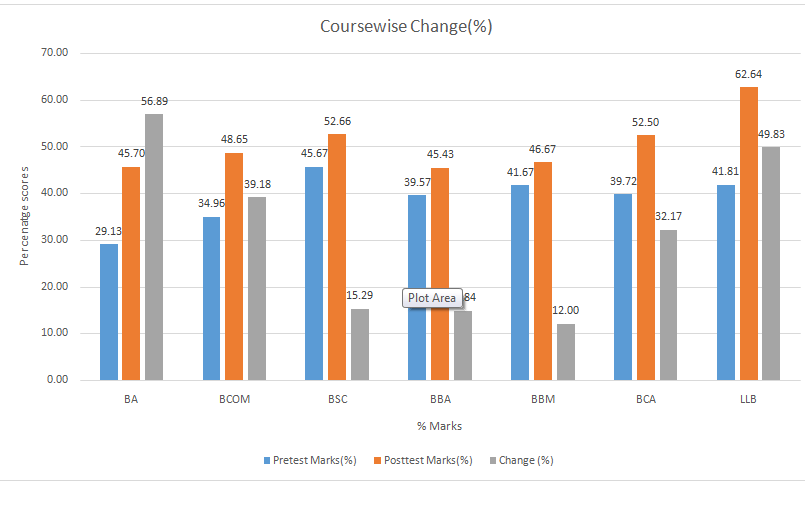


The above graph indicates that there is a substantial shift in the distribution of
the marks obtained during post-test indicating the impact of the project.
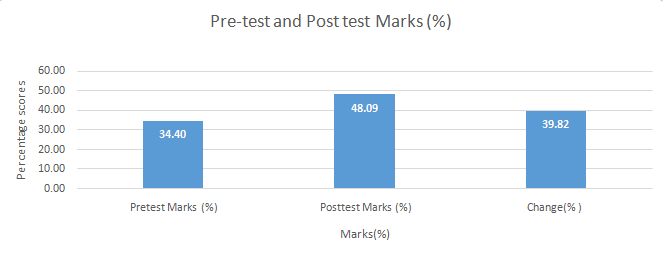
Pre-Test Post-Test Performance Comparison
From the data on Pre-test and Post-test the percentage marks scored in each component Reading, writing and MCQ was computed. The improvement in Post-test compared to Pre-test was computed for each part.